
What is Parseable?
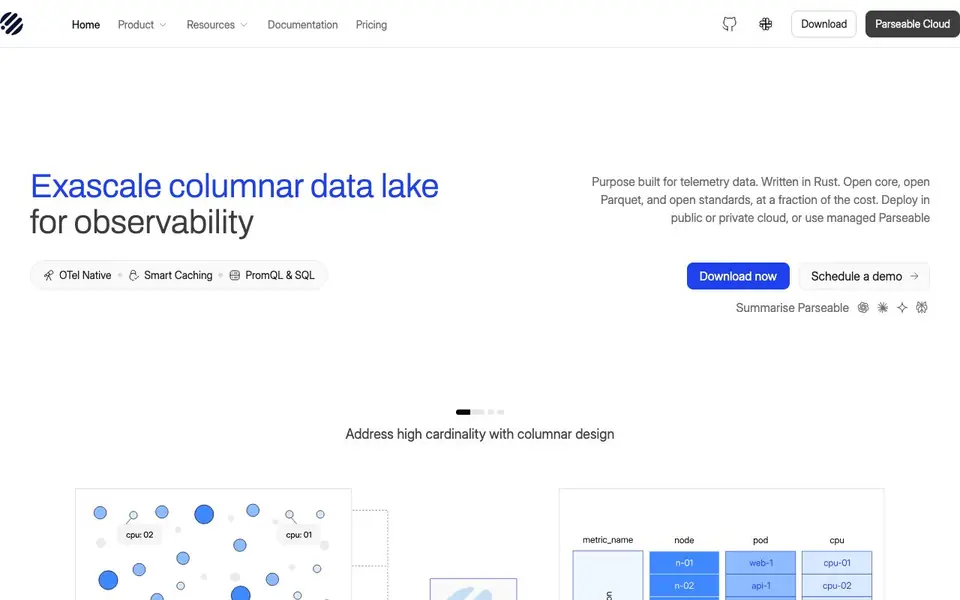
Parseable is an open-source observability platform that combines logs, metrics, and traces into a single, columnar data lake. Built in Rust, it uses open standards like OpenTelemetry and Parquet, and stores data directly in your object store (S3, MinIO, etc.). This design delivers high compression and significant cost savings compared to traditional tools like Datadog or Splunk.
You start by deploying Parseable on your own cloud or using the managed cloud service. Point it to your object store, configure your telemetry agents (like Fluent Bit or Prometheus), and you're ready. You can query data with SQL or natural language, set up dashboards and alerts, and use AI features for anomaly detection, root cause analysis, and trend summarization.
Parseable suits teams needing full observability with data sovereignty and low cost. It offers self-hosted open source (AGPLv3), managed cloud, and enterprise options with BYOC. The platform integrates with 60+ tools including Grafana, Kafka, and Kubernetes, and includes in-house tools like a Slack bot and CLI for investigation.
Parseable features
- Unified telemetry: Logs, metrics, and traces are stored together in one columnar data lake.
- AI analysis: Uses LLMs and ML to detect anomalies, summarize trends, and identify root causes.
- SQL and natural language queries: Query your telemetry with standard SQL or ask questions in plain English.
- OpenTelemetry native: Ingest data from OTel agents and other sources without proprietary formats.
- Object store native: Store data in your own S3 or compatible storage, reducing costs and ensuring data ownership.
What you can do with Parseable
- Investigate production incidents by analyzing logs, metrics, and traces together.
- Monitor Kubernetes clusters with automatic instrumentation and AI-driven insights.
- Reduce observability costs by replacing expensive commercial tools with Parseable.
- Maintain data sovereignty by storing telemetry in your own cloud object storage.
How to get started with Parseable
- Download Parseable or sign up for Parseable Cloud.
- Deploy it and point it to your object store (like S3).
- Configure your telemetry agents to send data to Parseable, then start querying and analyzing.
Tips for better results with Parseable
- Point Parseable at your own S3 or MinIO bucket first to keep data under your control and avoid vendor lock-in from the start.
- Configure your Fluent Bit or OpenTelemetry agents to send logs, metrics, and traces together so Parseable can correlate them for faster root cause analysis.
- Use Parseable's SQL or natural language queries to investigate incidents, but start with simple filters to understand your data schema before diving into complex joins.
- Set up Parseable's alerts on error rate spikes and baseline deviations to catch anomalies early, then use its AI analysis to summarize trends and identify underlying causes.
Parseable pricing
Parseable has a free way to start, with paid plans for heavier use. Check parseable.com for current limits and prices.
What to check before you rely on Parseable
- Check the pricing page for exact free tier limits and managed cloud costs, since the website only labels it freemium and does not list specific numbers.
- Verify that your object store is compatible with Parseable's requirements, as it relies on S3 or similar storage for all data persistence.
- Confirm that your telemetry agents support OpenTelemetry or other listed integrations, since Parseable does not accept proprietary formats and the website does not list every possible agent.
Who Parseable is for
Parseable suits DevOps engineers, SREs, Platform teams and Security-conscious enterprises. If that is not you, the AI data analysis tools below may fit better.
Similar tools compared with Parseable
| Tool | What it is | Pricing |
|---|---|---|
| Parseable | AI-native observability platform for logs, metrics, traces | Freemium |
| Julius AI | AI workspace for data and content | See website |
| Rows | AI-powered spreadsheet and data analyst | See website |
| Clay | AI platform for go-to-market workflows | Freemium |
| Semrush Copilot | SEO and AI search visibility platform | Freemium |
Parseable FAQ
What are the key features of Parseable?
Parseable unifies logs, metrics, and traces in one open observability platform. You get SQL and natural-language querying, dashboards, alerts, access controls, forecasting, and object-storage-native data management.
How does Parseable improve team collaboration?
Parseable provides shared dashboards and alerts that let teams see the same data in real time. Its AI analysis can summarize findings and suggest root causes, making it easier for teams to discuss and resolve issues together.
What security measures protect user data?
Parseable is GDPR certified and SOC 2 Type II compliant. It supports advanced access control and governance, and you can deploy it in your own cloud to keep full data ownership.
Can I use my existing observability stack?
Yes, Parseable integrates with 60+ tools including Prometheus, Grafana, Kafka, and OpenTelemetry. You can ingest data from your current agents and visualize it in tools you already use.
What can Parseable export or connect to?
Parseable integrates with 60+ tools including Grafana, Kafka, Kubernetes, and OpenTelemetry. It stores data in your own object store like S3 or MinIO, and supports SQL and PromQL queries. For specific export formats or destinations, check the documentation on parseable.com.
Does Parseable have a free plan and what does it include?
Parseable offers a freemium model. The open-source version is free under AGPLv3 and includes core features like logs, metrics, and traces. For managed cloud or enterprise features like PromQL and AI interface, you need to compare versions on their pricing page.
Can Parseable run on my own devices or cloud?
Yes, Parseable can be deployed on public or private cloud, or self-hosted on your own infrastructure. It's built in Rust and runs as a single binary. For specific device requirements or operating systems, refer to the installation documentation on parseable.com.


