
What is Bricks?
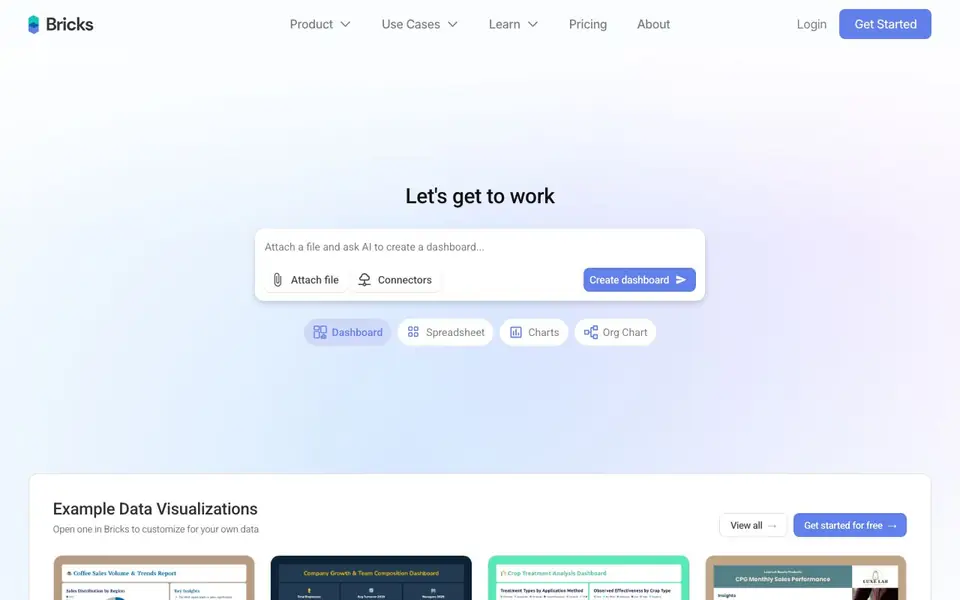
Bricks is an AI data analyst that converts your spreadsheet data into visual dashboards and reports. You upload a CSV or Excel file, or connect a data source, and Bricks generates charts, graphs, and layouts for you. It is designed for people who find Excel dashboards too manual, Canva too limited for data, and tools like Tableau or Power BI too complex.
You start by attaching your file or using a connector. Bricks then creates a dashboard you can customize by dragging blocks, editing data directly, or using natural language to ask for changes. When your data updates, one click refreshes all charts while keeping your layout. You can also save a dashboard as a template and reuse it with new data.
Bricks suits professionals like managers, analysts, and marketers who need clear, attractive reports without heavy BI training. The website highlights testimonials from users in banking, healthcare, and media. It offers example dashboards you can open and customize, and you can get started for free.
Bricks features
- Full control: Drag, drop, and customize every dashboard element manually or with AI.
- One-click refresh: Update your data and regenerate all charts while preserving your layout.
- Interactive filtering: Click any data point to filter the entire dashboard and spot patterns.
- Template reuse: Save your dashboard layout and apply it to fresh data anytime.
- Data import: Bring data from Google Sheets or databases to create dashboards.
What you can do with Bricks
- Create a monthly sales performance dashboard from your CRM export.
- Build a staff dashboard for your team using CSV data.
- Turn hospital admissions data into an interactive overview report.
- Generate a bank cash flow dashboard from your financial spreadsheet.
How to get started with Bricks
- Sign up for a free account on Bricks' website.
- Attach your CSV or Excel file or connect a data source like Google Sheets.
- Let AI generate your dashboard, then customize it with drag-and-drop or natural language.
Tips for better results with Bricks
- Start with a clean CSV or Excel file and remove duplicate columns before uploading, so Bricks can map your data accurately and generate meaningful charts without confusion.
- Use natural language commands in Bricks to tweak chart types, colors, or layouts, then fine-tune manually by dragging blocks for precise control over your dashboard design.
- Save a dashboard as a template after you perfect it, then reuse it with new data each month to keep your reports consistent and cut down on repetitive setup work.
- Click any data point in Bricks to filter the entire dashboard interactively, which helps you spot patterns and drill into specifics without rebuilding charts from scratch.
Bricks pricing
Bricks has a free way to start, with paid plans for heavier use. Check thebricks.com for current limits and prices.
What to check before you rely on Bricks
- Check whether the free plan includes all features you need, since the website labels Bricks as freemium but does not list specific limits or restrictions for unpaid use.
- Verify that your data source connectors cover the platforms you use, as the website mentions Google Sheets and databases but does not enumerate every supported integration.
- Confirm how your data is handled and stored, because the website does not state its privacy policy or data retention practices for uploaded files and dashboards.
Who Bricks is for
Bricks suits business analysts, managers, marketers and operations staff. If that is not you, the AI data analysis tools below may fit better.
Similar tools compared with Bricks
| Tool | What it is | Pricing |
|---|---|---|
| Bricks | AI dashboard and report creator | Freemium |
| Julius AI | AI workspace for data and content | See website |
| Rows | AI-powered spreadsheet and data analyst | See website |
| Clay | AI platform for go-to-market workflows | Freemium |
| Semrush Copilot | SEO and AI search visibility platform | Freemium |
Bricks FAQ
What data formats can I use with Bricks?
Bricks accepts CSV and Excel files. You can also import data from Google Sheets or databases using connectors, so you are not limited to just uploading files.
Is Bricks free to use?
The website says you can get started for free. It also mentions pricing in the navigation, so there are likely paid plans for more advanced features, but the details are not shown on the homepage.
Who is Bricks for?
Bricks is for professionals who need dashboards and reports from their data without mastering complex BI tools. It suits managers, analysts, marketers, and anyone who works with spreadsheets and wants quick, polished visuals.
Can I customize the dashboards Bricks creates?
Yes. You can drag and drop blocks, edit data directly on the dashboard, and use natural language to make changes with AI. You can also apply professional themes without any design skills.
What can Bricks export or connect to?
Bricks lets you import data from CSV, Excel files, Google Sheets, or databases. The website does not mention specific export formats or additional integrations beyond these connectors. For details on exporting your dashboards or connecting other tools, check the Bricks website or contact their support.
Does Bricks run on mobile devices or only on desktop?
Bricks is a web-based tool, so you can access it through a browser on any device with internet. The website does not specify dedicated mobile apps or offline support. For the best experience, use a desktop or laptop browser, but you can likely view and edit dashboards on tablets or phones.


