

What is GraphicInfo?
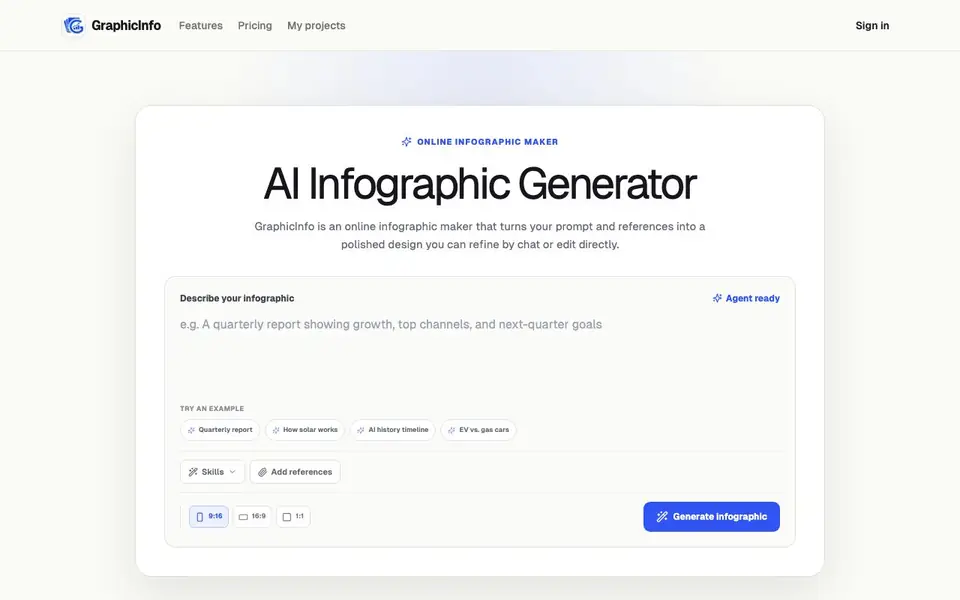
GraphicInfo is an online infographic maker that starts from your prompt and references. You describe your topic, audience, and visual direction, and an AI agent builds a complete HTML infographic for you. The result is not a static image; it is a design you can keep working on.
You refine the design in two ways. First, you can chat with the agent to rewrite, restyle, reorganize, or add visuals without starting over. Second, you can edit elements directly on the canvas, changing text, fonts, colors, size, position, and layer order. You can also upload images or text references and mention them in your prompt so the output reflects your source material.
To get started, you enter a topic, paste key facts, choose an aspect ratio like 9:16, 16:9, or 1:1, and attach references. The AI builds the infographic, then you refine and export it as PNG, JPEG, or WebP. The website shows examples like quarterly reports, solar energy explanations, and coffee production stages. It suits anyone who needs a polished visual story quickly, though the site does not state pricing details.
GraphicInfo features
- Prompt-to-infographic AI: Describe your topic, audience, and visual direction, and the AI creates a complete HTML infographic.
- Chat-based revisions: Ask the agent to rewrite, restyle, reorganize, or add visuals without restarting your project.
- Editable visual canvas: Select any element to edit text, fonts, colors, size, position, and layer order directly.
- Reference-aware design: Upload images or text references and mention them in your prompt for a tailored result.
- Multiple export formats: Export your finished design as PNG, JPEG, or WebP after refining.
What you can do with GraphicInfo
- Create a quarterly report infographic from your data and notes.
- Design a vertical 9:16 infographic explaining a process like coffee production.
- Build a landscape infographic about solar energy for an educational audience.
- Turn a text reference into a polished visual story for a presentation.
How to get started with GraphicInfo
- Enter your topic, paste key facts, choose an aspect ratio, and attach any useful references.
- Let the AI agent build a complete, editable HTML infographic from your brief.
- Refine by chat or edit elements on the canvas, then export as PNG, JPEG, or WebP.
Tips for better results with GraphicInfo
- Start GraphicInfo with a detailed prompt that names your topic, audience, and visual direction, and paste key facts so the AI builds a structured story you can refine.
- Use the chat-based revisions in GraphicInfo to request specific changes like rewriting text or reorganizing sections, instead of starting over from scratch.
- Upload your own images or text references and mention them in your prompt, so GraphicInfo tailors the infographic to your source material.
- After the AI generates your design, switch to the canvas in GraphicInfo to fine-tune fonts, colors, and layout directly for a polished final result.
GraphicInfo pricing
GraphicInfo’s homepage does not list prices. Check graphicinfo.cc for current plans.
What to check before you rely on GraphicInfo
- Check whether GraphicInfo has a free plan or trial, since the website does not state any pricing details or limits.
- Verify what account or sign-in requirements exist before you start, as the site shows a sign-in option but does not explain what it unlocks.
- Confirm that the PNG, JPEG, or WebP export formats meet your needs, and check if any resolution or quality limits apply, which are not listed.
Who GraphicInfo is for
GraphicInfo suits marketers, educators, business analysts and content creators. If that is not you, the AI design tools below may fit better.
Similar tools compared with GraphicInfo
| Tool | What it is | Pricing |
|---|---|---|
| GraphicInfo | AI infographic generator and editable canvas | See website |
| Looka | AI logo maker and brand identity platform | Freemium |
| Uizard | AI-powered UI design and prototyping tool | Freemium |
| Clipdrop | AI photo editing and image generation suite | See website |
| Interior AI | AI interior design and virtual staging app | Freemium |
GraphicInfo FAQ
What is an AI infographic generator?
It turns a written brief into a designed visual. GraphicInfo creates editable HTML, so you can continue refining the layout with chat or make precise changes on the canvas.
Can I edit an AI-generated infographic?
Yes. You can select elements on the canvas to edit text, fonts, colors, size, position, and layer order. You can also chat with the agent to rewrite or restyle parts of the design.
Can I upload my own images and references?
Yes. You can upload images or text references and mention them in your prompt. The AI uses those references to make the result reflect your source material.
Which image formats can I export?
You can export your finished infographic as PNG, JPEG, or WebP. The website does not mention other formats like PDF or SVG.
Does GraphicInfo require an account to use?
The GraphicInfo website does not mention whether you need an account to use the tool. To find out, check the sign-in or pricing section on graphicinfo.cc for any account requirements or trial details.
What can GraphicInfo export besides images?
GraphicInfo exports your finished design as PNG, JPEG, or WebP. The website does not mention other export formats like PDF or SVG. For the full list, check the export options in the editor or the FAQ section on graphicinfo.cc.
Does GraphicInfo work on mobile devices?
GraphicInfo is described as an online infographic maker, so it works in a web browser. The website does not specify whether it is optimized for mobile or has dedicated apps. Check the site on your phone or look for system requirements on graphicinfo.cc.


